Here’s a method for using the GDB tool to analyze Call Trace information generated by Linux.
Platform information
Platform: RUBIK Pi 3 (QCS6490)
Baseline: Qualcomm Linux 1.5
Yocto version: scarthgap
Linux kernel version: 6.6
The method for using GDB to analyze Linux Call Trace is platform agnostic. It’s applicable to any platform and baseline.
Conclusion first (easy operation via only two commands)
Use GDB to analyze vmlinux and .ko files. The file and line of the code with errors can be located based on address or function symbol + address offset. In most cases, the null pointer access issues can be located in a minute.
Commands for analyzing .ko files:
gdb-multiarch camera_qcm6490.ko

list *(cam_register_subdev+0xac)
You might need to know
GDB
GNU Debugger (GDB) is a powerful source code-level debugger. It can be used to debug user space programs at runtime (such as setting breakpoints) and also to analyze static Linux files.
- Why can static files be debugged? Use the following command to check the section information of an elf file:
readelf -S vmlinux
Output result:
tsdl@tsdl-HP-EliteDesk-880-G6-Tower-PC:~/Downloads$ readelf -S vmlinux
There are 43 section headers, starting at offset 0x14dd61c0:

Section Headers:
  [Nr] Name              Type             Address           Offset
       Size              EntSize          Flags  Link  Info  Align
  [ 0]                   NULL             0000000000000000  00000000
       0000000000000000  0000000000000000           0     0     0
  [ 1] .head.text        PROGBITS         ffffffc080000000  00010000
       0000000000010000  0000000000000000  AX       0     0     65536
  [ 2] .text             PROGBITS         ffffffc080010000  00020000
       0000000000ed3000  0000000000000000  AX       0     0     65536
  [ 3] .rodata           PROGBITS         ffffffc080ef0000  00f00000
       0000000000727666  0000000000000000  WA       0     0     4096
  [ 4] .pci_fixup        PROGBITS         ffffffc081617670  01627670
       0000000000002d90  0000000000000000   A       0     0     16
  [ 5] __ksymtab         PROGBITS         ffffffc08161a400  0162a400
       000000000000f7d4  0000000000000000   A       0     0     4
  [ 6] __ksymtab_gpl     PROGBITS         ffffffc081629bd4  01639bd4
       0000000000017808  0000000000000000   A       0     0     4
  [ 7] __ksymtab_strings PROGBITS         ffffffc0816413dc  016513dc
       0000000000040e5d  0000000000000001 AMS       0     0     1
  [ 8] __param           PROGBITS         ffffffc081682240  01692240
       00000000000037a0  0000000000000000   A       0     0     8
  [ 9] __modver          PROGBITS         ffffffc0816859e0  016959e0
       0000000000000510  0000000000000000  WA       0     0     8
  [10] __ex_table        PROGBITS         ffffffc081685ef0  01695ef0
       0000000000002b80  0000000000000000   A       0     0     4
  [11] .notes            NOTE             ffffffc081688a70  01698a70
       0000000000000054  0000000000000000   A       0     0     4
  [12] .hyp.rodata       PROGBITS         ffffffc081689000  01699000
       0000000000005000  0000000000000000  WA       0     0     16
  [13] .got              PROGBITS         ffffffc08168e000  0169e000
       0000000000000070  0000000000000008  WA       0     0     8
  [14] .got.plt          PROGBITS         ffffffc08168e070  0169e070
       0000000000000018  0000000000000008  WA       0     0     8
  [15] .rodata.text      PROGBITS         ffffffc08168e800  0169e800
       0000000000005800  0000000000000000  AX       0     0     2048
  [16] .init.text        PROGBITS         ffffffc0816a0000  016b0000
       0000000000068f14  0000000000000000  AX       0     0     8
  [17] .exit.text        PROGBITS         ffffffc081708f18  01718f18
       000000000000618c  0000000000000000  AX       0     0     8
  [18] .altinstructions  PROGBITS         ffffffc08170f0a4  0171f0a4
       000000000004e240  0000000000000000   A       0     0     1
  [19] .init.data        PROGBITS         ffffffc081765000  01775000
       0000000000035cd8  0000000000000000  WA       0     0     256
  [20] .data..percpu     PROGBITS         ffffffc08179b000  017ab000
       0000000000015168  0000000000000000  WA       0     0     64
  [21] .hyp.data..percpu PROGBITS         ffffffc0817b1000  017c1000
       00000000000021c0  0000000000000000  WA       0     0     16
  [22] .hyp.reloc        PROGBITS         ffffffc0817b31c0  017c31c0
       0000000000000270  0000000000000000   A       0     0     4
  [23] .rela.dyn         RELA             ffffffc0817b3430  017c3430
       0000000000548610  0000000000000018   A       0     0     8
  [24] .data             PROGBITS         ffffffc081d00000  01d10000
       00000000004b56a8  0000000000000000  WA       0     0     4096
  [25] __bug_table       PROGBITS         ffffffc0821b56a8  021c56a8
       0000000000018ed0  0000000000000000  WA       0     0     4
  [26] .mmuoff.data.writ PROGBITS         ffffffc0821ce800  021de800
       0000000000000008  0000000000000000  WA       0     0     2048
  [27] .mmuoff.data.read PROGBITS         ffffffc0821cf000  021df000
       0000000000000008  0000000000000000  WA       0     0     8
  [28] .pecoff_edata_pad PROGBITS         ffffffc0821cf008  021df008
       00000000000001f8  0000000000000000   A       0     0     1
  [29] .bss              NOBITS           ffffffc0821d0000  021df200
       00000000000ac680  0000000000000000  WA       0     0     4096
  [30] .debug_aranges    PROGBITS         0000000000000000  021df200
       000000000002d960  0000000000000000           0     0     16
  [31] .debug_info       PROGBITS         0000000000000000  0220cb60
       000000000d6244df  0000000000000000           0     0     1
  [32] .debug_abbrev     PROGBITS         0000000000000000  0f83103f
       0000000000673382  0000000000000000           0     0     1
  [33] .debug_line       PROGBITS         0000000000000000  0fea43c1
       0000000001b1316d  0000000000000000           0     0     1
  [34] .debug_frame      PROGBITS         0000000000000000  119b7530
       000000000039aed8  0000000000000000           0     0     8
  [35] .debug_str        PROGBITS         0000000000000000  11d52408
       000000000048de8c  0000000000000001  MS       0     0     1
  [36] .debug_line_str   PROGBITS         0000000000000000  121e0294
       0000000000025f05  0000000000000001  MS       0     0     1
  [37] .debug_loclists   PROGBITS         0000000000000000  12206199
       0000000001fa5a54  0000000000000000           0     0     1
  [38] .debug_rnglists   PROGBITS         0000000000000000  141abbed
       0000000000473639  0000000000000000           0     0     1
  [39] .comment          PROGBITS         0000000000000000  1461f226
       0000000000000012  0000000000000001  MS       0     0     1
  [40] .symtab           SYMTAB           0000000000000000  1461f238
       00000000004b2568  0000000000000018          41   171684     8
  [41] .strtab           STRTAB           0000000000000000  14ad17a0
       0000000000304849  0000000000000000           0     0     1
  [42] .shstrtab         STRTAB           0000000000000000  14dd5fe9
       00000000000001d0  0000000000000000           0     0     1
Key to Flags:
  W (write), A (alloc), X (execute), M (merge), S (strings), I (info),
  L (link order), O (extra OS processing required), G (group), T (TLS),
  C (compressed), x (unknown), o (OS specific), E (exclude),
  p (processor specific)
There is debug section information in the output. If the static file contains the debug section, GDB is an applicable tool for analysis. For example:
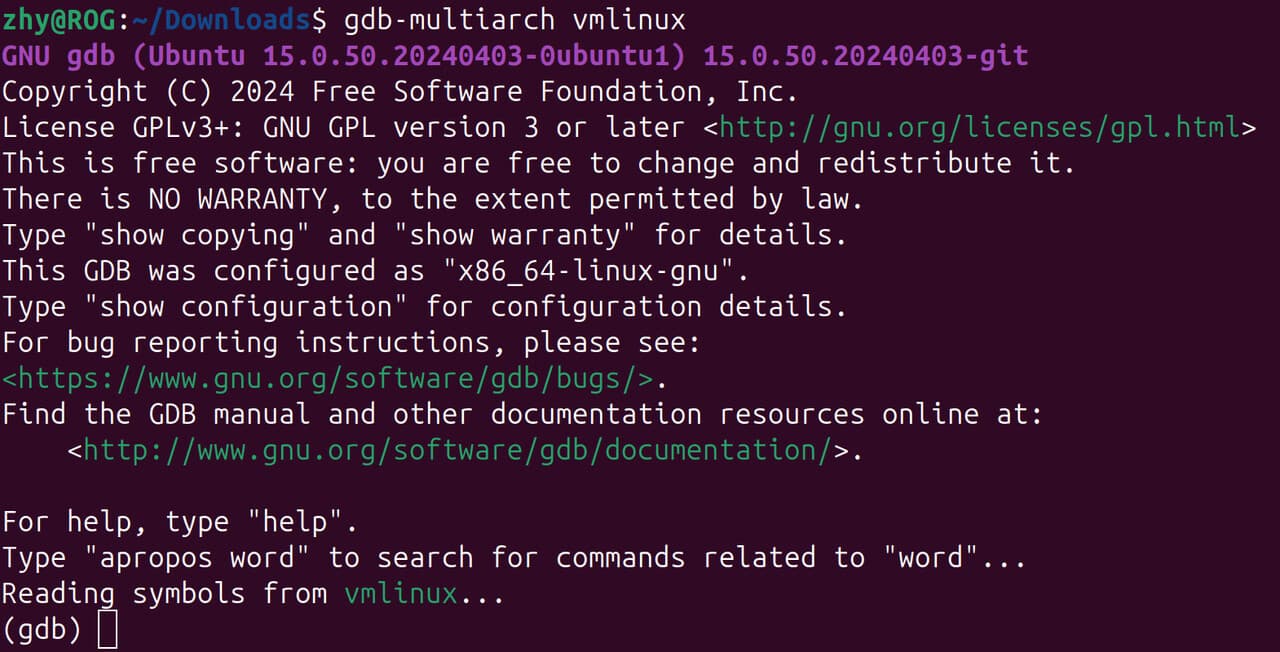
Enter GDB mode
gdb-multiarch vmlinux
Run the following command to install the
gdb-multiarchcommand:
sudo apt install gdb-multiarch
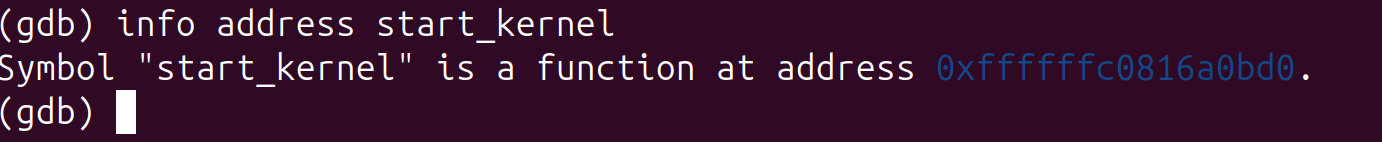
Obtain the function load address
info address start_kernel
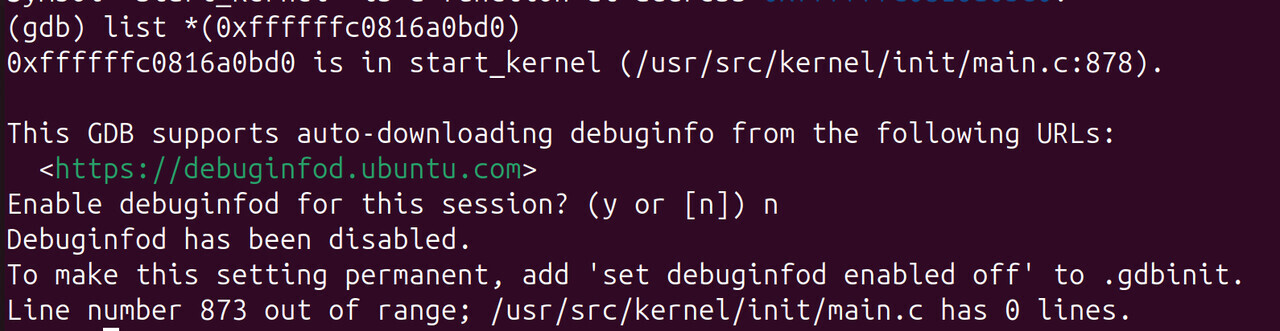
Locate the source code file and line based on the address
list *(0xffffffc0816a0bd0)
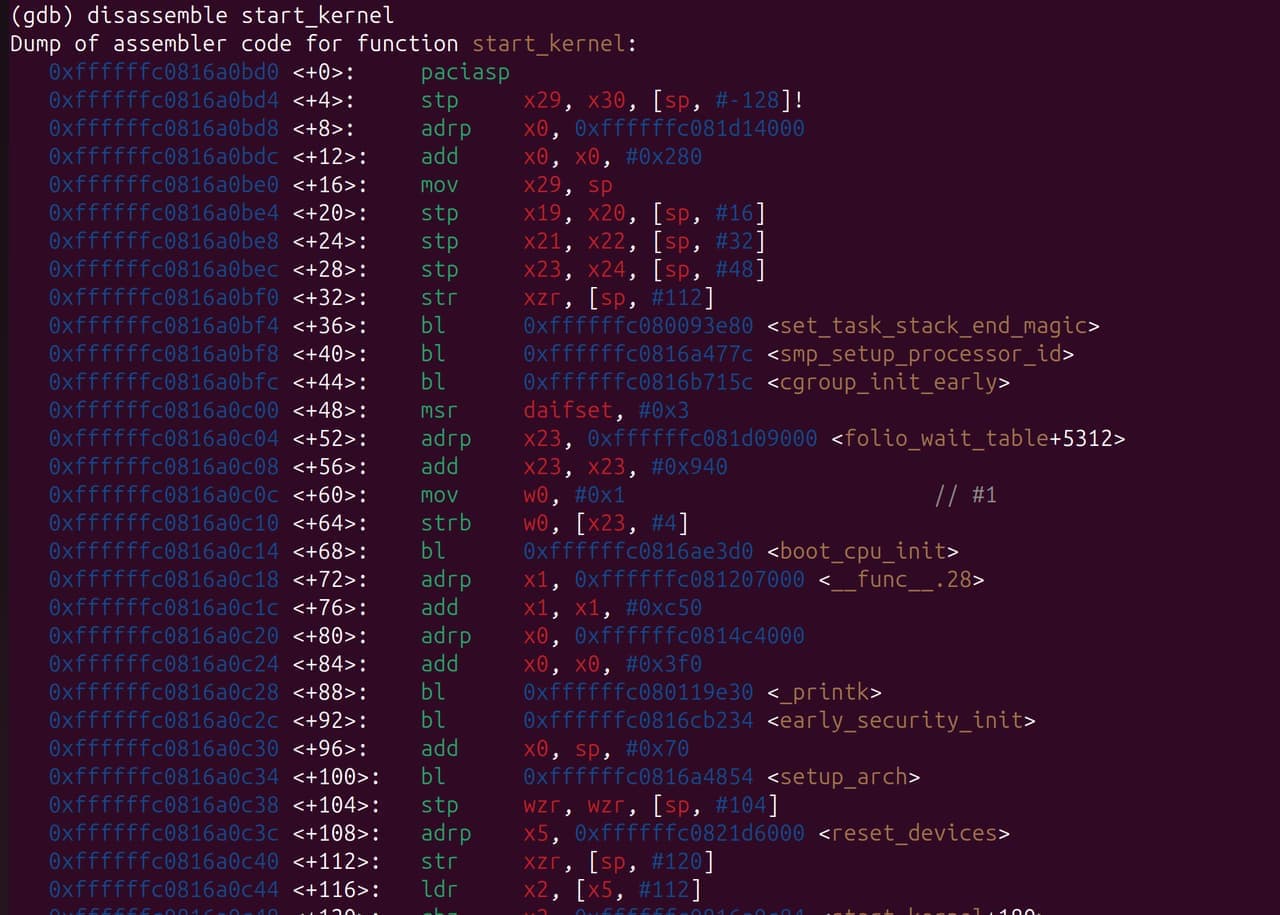
Check the disassembly code
disassemble start_kernel
Exit GDB mode
quit
vmlinux
- Common kernel images and corresponding relationships

vmlinux (where VM means Virtual Memory) is the Linux kernel elf file without compression. It contains the complete symbol table and debugging information and is not compressed or optimized. Typically, this file is not directly used for booting up the system, but serves as the basis for generating kernel images in other formats. vmlinux is mainly used in kernel development and debugging.
.ko
A kernel object (.ko) is the dynamically linked file used by the kernel. It can be loaded dynamically. Drivers are compiled into .ko files and automatically loaded during boot-up.
A .ko file contains symbol information (offset address) and can be analyzed using the GDB tool.
Please note that a .ko file is relocatable rather than an executable. This means that .ko files do not have fixed load addresses. The modules’ load addresses are accessible via cat /proc/kallsyms. However, during most kernel crashes, when the system becomes inaccessible, we can still pinpoint the problem using the symbol name combined with the offset address found in the call trace.
Analysis procedure
Call Trace caused by the kernel module (.ko file)
Background
During the boot, the kernel crashes due to a null pointer. The serial port outputs call trace information, and then the system reboots (dump is not enabled). The crash issue needs to be resolved.
[    6.275632][  T126] Unable to handle kernel NULL pointer dereference at virtual address 0000000000000008
[    6.285379][  T126] Mem abort info:
[    6.285380][  T126]   ESR = 0x0000000096000045
[    6.285381][  T126]   EC = 0x25: DABT (current EL), IL = 32 bits
[    6.289274][  T126]   SET = 0, FnV = 0
[    6.289275][  T126]   EA = 0, S1PTW = 0
[    6.289276][  T126]   FSC = 0x05: level 1 translation fault
[    6.289277][  T126] Data abort info:
[    6.289277][  T126]   ISV = 0, ISS = 0x00000045, ISS2 = 0x00000000
[    6.289278][  T126]   CM = 0, WnR = 1, TnD = 0, TagAccess = 0
[    6.289279][  T126]   GCS = 0, Overlay = 0, DirtyBit = 0, Xs = 0
[    6.289280][  T126] user pgtable: 4k pages, 39-bit VAs, pgdp=000000010c261000
[    6.289699][  T674] CAM_INFO: CAM-SMMU: cam_smmu_need_force_alloc_cached: 383: force_cache_allocs=0
[    6.289712][  T674] CAM_ERR: CAM-MEM: cam_mem_mgr_get_dma_heaps: 474: qcom system-uncached heap not found, rc=0
[    6.289805][  T674] CAM_WARN: CAM-CRM: cam_req_mgr_close: 189: release invoked associated userspace process has died, open_cnt: 1
[    6.293860][  T618] cam_req_mgr soc@0:qcom,cam-req-mgr: bound soc@0:qcom,cam_smmu (ops cam_smmu_component_ops [camera_qcm6490])
[    6.300568][  T126] [0000000000000008] pgd=0000000000000000
[    6.304048][  T618] cam_req_mgr soc@0:qcom,cam-req-mgr: bound soc@0:qcom,cam_smmu:msm_cam_smmu_secure (ops cam_smmu_cb_component_ops [camera_qcm6490])
[    6.309886][  T126] , p4d=0000000000000000
[    6.313768][  T618] cam_req_mgr soc@0:qcom,cam-req-mgr: bound soc@0:qcom,cam_smmu:msm_cam_smmu_lrme (ops cam_smmu_cb_component_ops [camera_qcm6490])
[    6.320006][  T126] , pud=0000000000000000
[    6.323810][  T618] cam_req_mgr soc@0:qcom,cam-req-mgr: bound soc@0:qcom,cam_smmu:msm_cam_smmu_cpas_cdm (ops cam_smmu_cb_component_ops [camera_qcm6490])
[    6.329850][  T126]
[    6.333849][  T526] lt9611 9-0039: audio support = 0
[    6.333910][  T526] lt9611 9-0039: supply vdd not found, using dummy regulator
[    6.335907][  T618] cam_req_mgr soc@0:qcom,cam-req-mgr: bound soc@0:qcom,cam_smmu:msm_cam_smmu_icp (ops cam_smmu_cb_component_ops [camera_qcm6490])
[    6.343223][  T126] Internal error: Oops: 0000000096000045 [#1] PREEMPT SMP
[    6.343227][  T126] Modules linked in: lontium_lt9611(+)
[    6.352610][  T618] cam_req_mgr soc@0:qcom,cam-req-mgr: bound soc@0:qcom,cam_smmu:msm_cam_icp_fw (ops cam_smmu_fw_dev_component_ops [camera_qcm6490])
[    6.363032][  T126]  rpmsg_ctrl camera_qcm6490(OE+) cec husb238 qrtr_smd fastrpc rpmsg_char rpisense_core kfifo_buf snd_soc_es8316 spidev qmi_cooling typec_ucsi pmic_glink_altmode qcom_battmgr hci_uart snd_sw
[    6.375104][  T618] cam_req_mgr soc@0:qcom,cam-req-mgr: bound soc@0:qcom,cam_smmu:msm_cam_smmu_jpeg (ops cam_smmu_cb_component_ops [camera_qcm6490])
[    6.386846][  T126]  bcmdhd snd_soc_qcom_common bluetooth iris_vpu(O) gpio_sbu_mux snd_soc_simple_card_utils v4l2_mem2mem videobuf2_v4l2 cfg80211
[    6.392585][  T618] cam_req_mgr soc@0:qcom,cam-req-mgr: bound soc@0:qcom,cam_smmu:msm_cam_smmu_ife (ops cam_smmu_cb_component_ops [camera_qcm6490])
[    6.406389][  T126]  ocmem videodev gpu_sched qcom_pon drm_display_helper nvmem_qcom_spmi_sdam qcom_spmi_adc_tm5 rtc_pm8xxx ecdh_generic
[    6.411214][  T618] CAM_INFO: CAM-CPAS: cam_cpas_get_hw_features: 515: feature 0x4 addr 0x7801fc, mask 0x10, shift 0x4 type 0x0 hw_map 0x4
[    6.424232][  T126]  ecc videobuf2_common drm_dp_aux_bus qcom_stats rfkill mc spi_geni_qcom i2c_qcom_geni phy_qcom_qmp_combo typec gpi msm_kgsl(O) icc_bwmon
[    6.428455][  T618] CAM_INFO: CAM-CPAS: cam_cpas_get_hw_features: 539: fuse_addr 0x7801fc, fuse_val 70000
[    6.442442][  T126]  qcom_eud qcrypto qcom_q6v5_pas pinctrl_sc7280_lpass_lpi qcom_rproc_minidump display_connector qcom_pil_info pinctrl_lpass_lpi llcc_qcom sha256_generic
[    6.444694][  T618] CAM_INFO: CAM-CPAS: cam_cpas_get_hw_features: 598: feature 0x4 enable=1 hw_map=0x4
[    6.447554][  T124] Bluetooth: hci0: BCM: chip id 130
[    6.447845][  T124] Bluetooth: hci0: BCM: features 0x0f
[    6.448966][  T124] Bluetooth: hci0: BCM4345C5
[    6.448971][  T124] Bluetooth: hci0: BCM4345C5 (003.006.006) build 0000
[    6.449711][  T124] Bluetooth: hci0: BCM4345C5 'brcm/BCM4345C5.hcd' Patch
[    6.449784][  T126]  qcom_q6v5 xhci_pci authenc drm_kms_helper qcom_sysmon xhci_pci_renesas libdes pwm_fan
[    6.457201][  T618] CAM_INFO: CAM-CPAS: cam_cpas_get_hw_features: 515: feature 0x6 addr 0x7801fc, mask 0x20, shift 0x5 type 0x0 hw_map 0x10
[    6.470746][  T126]  qcom_rng pmic_glink icc_osm_l3 socinfo stm_p_ost stm_heartbeat stm_ftrace
[    6.477898][  T618] CAM_INFO: CAM-CPAS: cam_cpas_get_hw_features: 598: feature 0x6 enable=1 hw_map=0x10
[    6.483342][  T126]  stm_console nt36xxx_i2c(O) panel_event_notifier ipa qcom_common qcom_glink_smem
[    6.497075][  T618] CAM_INFO: CAM-CPAS: cam_cpas_get_hw_features: 515: feature 0x7 addr 0x7801fc, mask 0x40, shift 0x6 type 0x0 hw_map 0xff
[    6.520495][  T126]  mdt_loader coresight_tpdm coresight_tpda coresight_tmc usb_f_qdss coresight_tgu coresight_stm stm_core coresight_replicator
[    6.534143][  T618] CAM_INFO: CAM-CPAS: cam_cpas_get_hw_features: 598: feature 0x7 enable=1 hw_map=0xff
[    6.547504][  T126]  qrtr coresight_remote_etm coresight_csr coresight_funnel coresight_dummy zram zsmalloc drm
[    6.561062][  T618] CAM_INFO: CAM-CPAS: cam_cpas_get_hw_features: 515: feature 0x0 addr 0x7801fc, mask 0x80, shift 0x7 type 0x0 hw_map 0xff
[    6.573631][  T126]  coresight_cti coresight at803x fuse ipv6
[    6.573636][  T126] CPU: 4 PID: 126 Comm: kworker/u16:6 Tainted: G           OE      6.6.90 #1
[    6.586477][  T618] CAM_INFO: CAM-CPAS: cam_cpas_get_hw_features: 598: feature 0x0 enable=1 hw_map=0xff
[    6.600819][  T126] Hardware name: Thundercomm, Inc. RUBIK Pi 3 (DT)
[    6.600820][  T126] Workqueue: events_unbound deferred_probe_work_func
[    6.610729][  T618] CAM_INFO: CAM-CPAS: cam_cpas_get_hw_features: 515: feature 0x8 addr 0x7801fc, mask 0x100, shift 0x8 type 0x0 hw_map 0x10
[    6.626410][  T126]
[    6.626411][  T126] pstate: 60400005 (nZCv daif +PAN -UAO -TCO -DIT -SSBS BTYPE=--)
[    6.626413][  T126] pc : cam_register_subdev+0xac/0x260 [camera_qcm6490]
[    6.636054][  T618] CAM_INFO: CAM-CPAS: cam_cpas_get_hw_features: 598: feature 0x8 enable=1 hw_map=0x10
[    6.641236][  T126] lr : cam_register_subdev+0x70/0x260 [camera_qcm6490]
[    6.646607][  T618] CAM_INFO: CAM-CPAS: cam_cpas_get_hw_features: 515: feature 0x9 addr 0x7801a4, mask 0x10000000, shift 0x1c type 0x0 hw_map 0xff
[    6.651159][  T126] sp : ffffffc0835c3ad0
[    6.651160][  T126] x29: ffffffc0835c3ad0 x28: 0000000000000000 x27: 0000000000000000
[    6.651162][  T126] x26: 0000000000000000 x25: 0000000000000000 x24: 000000000000015e
[    6.657959][  T618] CAM_INFO: CAM-CPAS: cam_cpas_get_hw_features: 539: fuse_addr 0x7801a4, fuse_val 20000000
[    6.664921][  T126]
[    6.664922][  T126] x23: ffffffe860924e60 x22: ffffff808c835b40 x21: ffffff808c835a88
[    6.664924][  T126] x20: ffffffe860927468 x19: ffffff808c835a80 x18: ffffffffffffffff
[    6.674829][  T618] CAM_INFO: CAM-CPAS: cam_cpas_get_hw_features: 598: feature 0x9 enable=1 hw_map=0xff
[    6.680228][  T526] lt9611 9-0039: LT9611 revision: 0xe2.17.02
[    6.687745][  T126] x17: 646e756f66204f49 x16: ffffffe8ce84861c x15: 3132203a61746164
[    6.687747][  T126] x14: 5f74645f7465675f x13: 000000000000054b x12: 00000000ffffffea
[    6.687749][  T126] x11: 00000000ffffdfff
[    6.699094][  T618] CAM_INFO: CAM-CPAS: cam_cpas_hw_get_hw_info: 1862: fuse info->num_fuses 2
[    6.706293][  T126]  x10: ffffffe8cf76c190 x9 : ffffffe8cf6bc130
[    6.706295][  T126] x8 : ffffff8081584d80 x7 : 00000000ffffffff x6 : ffffff808c835b60
[    6.706297][  T126] x5 : 000000000001000c x4 : ffffff808c835c30 x3 : 0000000000000000
[    6.706299][  T126] x2 : ffffffe860821268 x1 : ffffffe8609274d8
[    6.739312][  T526] lt9611 9-0039: CEC adapter registered
[    6.742019][  T126]  x0 : 0000000000000000
[    6.751746][  T526] lt9611 9-0039: CEC init success
[    6.762082][  T126]
[    6.762083][  T126] Call trace:
[    6.762085][  T126]  cam_register_subdev+0xac/0x260 [camera_qcm6490]
[    7.038678][  T126]  cam_eeprom_init_subdev+0x78/0xd0 [camera_qcm6490]
[  OK  ] Found device /dev/fastrpc-adsp-secu[    7.045re.
[    7.083094][  T126]  i2c_device_probe+0x1b4/0x35c
[    7.088835][  T126]  really_probe+0x148/0x2b0
[    7.093415][  T126]  __driver_probe_device+0x78/0x12c
[    7.098704][  T126]  driver_probe_device+0x3c/0x15c
[    7.103814][  T126]  __device_attach_driver+0xb8/0x134
[    7.109188][  T126]  bus_for_each_drv+0x88/0xe8
[    7.113940][  T126]  __device_attach+0xa0/0x190
[    7.118688][  T126]  device_initial_probe+0x14/0x20
[    7.123790][  T126]  bus_probe_device+0xac/0xb0
[    7.128533][  T126]  deferred_probe_work_func+0x88/0xc0
[    7.133985][  T126]  process_one_work+0x170/0x400
[    7.138904][  T126]  worker_thread+0x320/0x438
[    7.143554][  T126]  kthread+0x110/0x114
[    7.143556][  T126]  ret_from_fork+0x10/0x20
[  OK  ] Found device /dev/fastrpc-cdsp-secu[    7.143re.
[    7.189680][  T126] ---[ end trace 0000000000000000 ]---
[    7.195962][  T126] Kernel panic - not syncing: Oops: Fatal exception
[    7.200283][  T124] Bluetooth: hci0: BCM: features 0x0f
[    7.202028][  T124] Bluetooth: hci0: BCM4345C5 Ampak AP5256 UART 37.4 MHz BT 5.2 [Version: 1081.1154]
[    7.202030][  T124] Bluetooth: hci0: BCM4345C5 (003.006.006) build 1154
[    7.224571][  T126] SMP: stopping secondary CPUs
[    7.229406][  T126] Triggering bite
[    7.233079][  T126] gh-watchdog hypervisor:qcom,gh-watchdog: Causing a QCOM Apps Watchdog bite!
[    7.242175][  T126] gh-watchdog hypervisor:qcom,gh-watchdog: vWdog-CTL: 1, vWdog-time since last pet: 2358, vWdog-expired status: 1
Analysis
- Based on the print information, we can infer
a. Null pointer access occurred (since it’s a 64-bit system,0000000000000008most likely indicates accessing the second parameter of a structure)
b. The module where the issue occurred iscamera_qcm6490.
c. The function that ultimately caused the crash iscam_register_subdev.
d. The memory address where the issue occurred iscam_register_subdev+0xac, which is approximately 28% into the entirecam_register_subdevfunction (0xac is the address offset, 0x260 is the total function size, 0x260 bytes, and 0xac/0x260 ≈ 172/608 ≈ 0.28. This 28% is more relevant for analyzing the assembly instruction flow and may not directly correlate to the C source code.)
Unable to handle kernel NULL pointer dereference at virtual address 0000000000000008

cam_register_subdev+0xac/0x260 [camera_qcm6490]
- Obtain the .ko file where the issue occurred
camera_qcm6490.ko - Use GDB to load the .ko file.
gdb-multiarch camera_qcm6490.ko
or
gdb-multiarch vmlinux
add-symbol-file camera_qcm6490.ko
- Locate the file and line.
a. Locate cam_register_subdev.
info functions cam_register_subdev
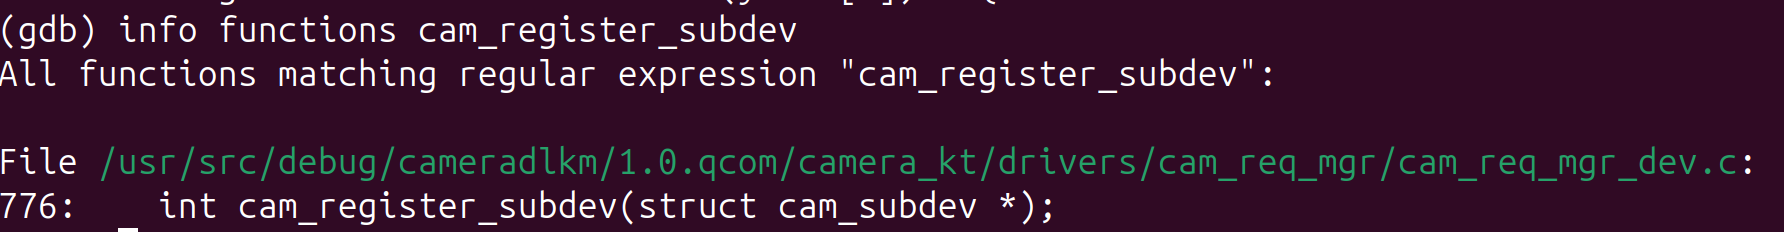
b. List the whole function.
int cam_register_subdev(struct cam_subdev *csd)
{
        struct v4l2_subdev *sd;
        int rc;

        if (!g_dev.state) {
                CAM_DBG(CAM_CRM, "camera root device not ready yet");
                return -EPROBE_DEFER;
        }

        if (!csd || !csd->name) {
                CAM_ERR(CAM_CRM, "invalid arguments");
                return -EINVAL;
        }

        mutex_lock(&g_dev.dev_lock);

        sd = &csd->sd;
        v4l2_subdev_init(sd, csd->ops);
        sd->internal_ops = csd->internal_ops;
        snprintf(sd->name, V4L2_SUBDEV_NAME_SIZE, "%s", csd->name);
        v4l2_set_subdevdata(sd, csd->token);

        sd->flags = csd->sd_flags;
        sd->entity.num_pads = 0;
        sd->entity.pads = NULL;
        sd->entity.function = csd->ent_function;

        list_add(&csd->list, &cam_req_mgr_ordered_sd_list);
        list_sort(NULL, &cam_req_mgr_ordered_sd_list,
                cam_req_mgr_ordered_list_cmp);

        rc = v4l2_device_register_subdev(g_dev.v4l2_dev, sd);
        if (rc) {
                CAM_ERR(CAM_CRM, "register subdev failed");
                goto reg_fail;
        }

        rc = v4l2_device_register_subdev_nodes(g_dev.v4l2_dev);
        if (rc) {
                CAM_ERR(CAM_CRM, "Failed to register subdev node: %s, rc: %d",
                        sd->name, rc);
                goto reg_fail;
        }

        if (sd->flags & V4L2_SUBDEV_FL_HAS_DEVNODE) {
                sd->entity.name = video_device_node_name(sd->devnode);
                CAM_DBG(CAM_CRM, "created node :%s", sd->entity.name);
        }

        g_dev.count++;

reg_fail:
        mutex_unlock(&g_dev.dev_lock);
        return rc;
}
c. Locate the line
list *(cam_register_subdev+0xac)
In line 153 of list.h
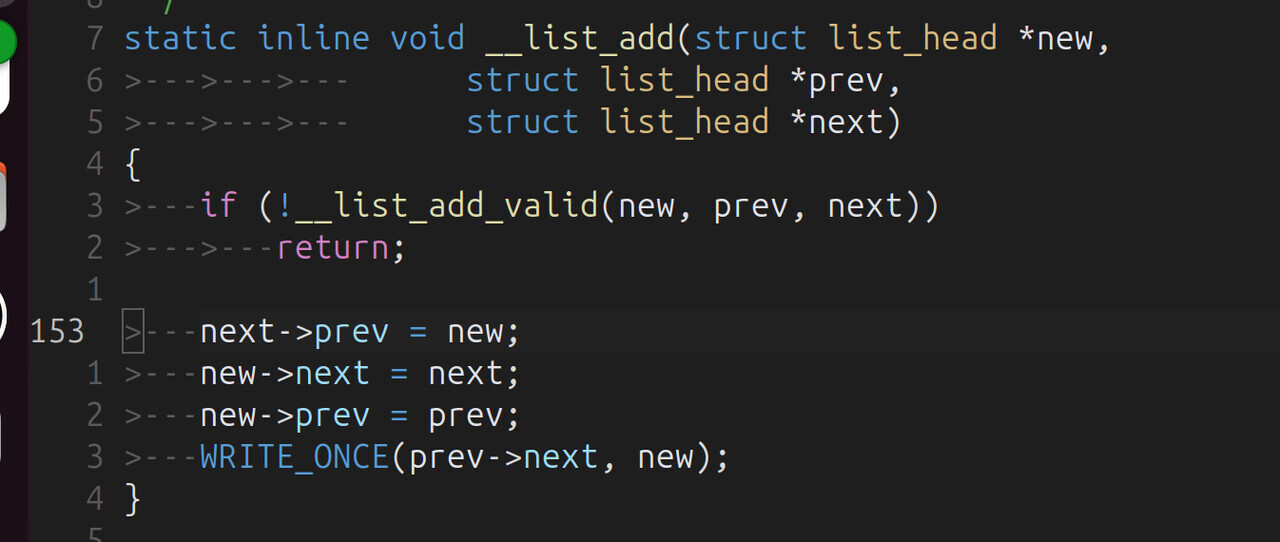
It indicates that the issue occurred on
next->prev = new;. next is the null pointer, and prev is the second parameter of the list_head structure. The hypothesis was correct.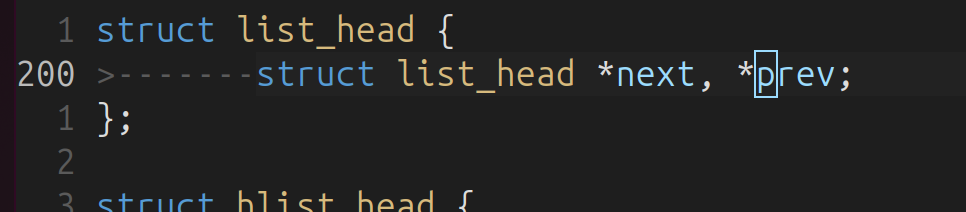
The reason why
list.h is located is that most list-related functions are inline. Therefore, we examine the linked list operation function of the original function:(This issue can also be located by examining the assembly code, for example, by counting the
bl instructions).
list_add(&csd->list, &cam_req_mgr_ordered_sd_list);
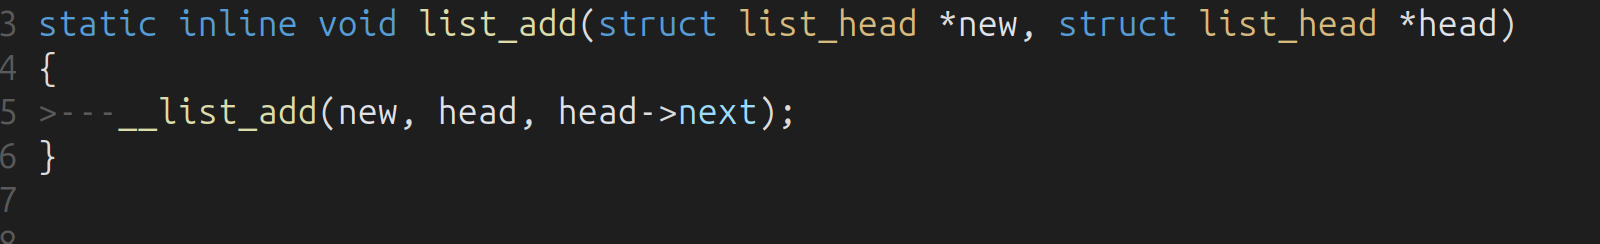
Based on the list_add and __list_add functions, we can determine that the
next parameter of cam_req_mgr_ordered_sd_list is not initialized, that is, the linked list cam_req_mgr_ordered_sd_list is not initialized, and next is null. Consequently, when trying to access the second member (prev) of this null pointer, it’s equivalent to:
(list_head *)0->prev
Solution
Initialize the linked list before calling list_add:
diff --git a/camera_kt/drivers/cam_req_mgr/cam_req_mgr_dev.c b/camera_kt/drivers/cam_req_mgr/cam_req_mgr_dev.c
index bde4e14f..7df323c8 100644
--- a/camera_kt/drivers/cam_req_mgr/cam_req_mgr_dev.c
+++ b/camera_kt/drivers/cam_req_mgr/cam_req_mgr_dev.c
@@ -33,7 +33,7 @@
 static struct cam_req_mgr_device g_dev;
 struct kmem_cache *g_cam_req_mgr_timer_cachep;
 static struct list_head cam_req_mgr_ordered_sd_list;
-
+static LIST_HEAD(cam_req_mgr_ordered_sd_list);
 DECLARE_RWSEM(rwsem_lock);

 static struct device_attribute camera_debug_sysfs_attr =
@@ -882,8 +882,6 @@ static int cam_req_mgr_component_master_bind(struct device *dev)
         if (rc)
                 goto video_setup_fail;

-        INIT_LIST_HEAD(&cam_req_mgr_ordered_sd_list);
-
         if (g_cam_req_mgr_timer_cachep == NULL) {
                 g_cam_req_mgr_timer_cachep = KMEM_CACHE(cam_req_mgr_timer, 0x0);

--
2.25.1
Call Trace caused by the kernel image
The cause is the same as that of ko. Cases will be updated when similar issues occur.
Reference
Frequently used GDB commands (AI-generated, for reference only):
(gdb) info functions          # View all function symbols
(gdb) info variables          # View all variable symbols
(gdb) info types              # View all type definitions
(gdb) info functions cam_     # View all functions starting with cam_
(gdb) info variables g_       # View all variables starting with g_
(gdb) info functions ^cam_.*  # Use regular expression
(gdb) info address cam_register_subdev    # View function address
(gdb) info symbol 0xffffffc00123ebd8      # Query symbol name using the address
(gdb) whatis cam_register_subdev          # View symbol types
(gdb) disassemble cam_register_subdev           # Disassemble the entire function
(gdb) disassemble cam_register_subdev +0xac     # Start from specific offset
(gdb) disassemble 0xffffffc00123ebd8, +20       # Disassembly address range
(gdb) disassemble /m cam_register_subdev        # Mixed display of source code and assembly
(gdb) disassemble /r cam_register_subdev        # Display raw bytecode
(gdb) disassemble /mr cam_register_subdev       # Mixed display + raw bytecode
(gdb) maintenance info sections                 # Display all section information
(gdb) info files                                # Display file segment mapping
(gdb) info target                               # Display target file information
(gdb) x/10i &cam_register_subdev                # View the code segment
(gdb) x/10x &g_dev                             # View the data segment
(gdb) x/10s device_name                         # View the character string


(gdb) p &cam_register_subdev                    # Obtain function address
$1 = (void (*)(void)) 0xffffffc00123ebd8
(gdb) p &cam_unregister_subdev                  # Obtain the next function address
$2 = (void (*)(void)) 0xffffffc00123ef84

(gdb) p &cam_unregister_subdev - &cam_register_subdev
$3 = 0x3ac                                     # Calculate function size

(gdb) ptype struct cam_subdev                   # View structure definition
(gdb) ptype /o struct cam_subdev                # Display offset layout
(gdb) print sizeof(struct cam_subdev)           # View structure size
(gdb) print &((struct cam_subdev *)0)->name     # View member offset
2025-11-05T16:00:00Z
Original post: [调试][linux] 在主机中使用 GDB 命令分析 Linux Call Trace 信息 - 技术分享 - RUBIK Pi by Hongyang Zhao