Many teams are using OSHI for better hardware metrics collection. The new system can track platform-specific metrics across different boards—Raspberry Pi voltage and throttling, RK3588 NPU load, thermal zones, network traffic, and more.
There’s one critical piece missing: NPU utilization data for the QCS6490.
Other NPU-equipped platforms already expose this information. The RK3588 lets us monitor NPU load, which helps users understand system performance and diagnose bottlenecks. The QCS6490 should be able to do the same.
Customers have NDA with QC can use above profiling tool to check NPU & GPU loading.
For the community users without the NDA, we need to check internally how to support.
@ramim@samf
There’s an alternative, other than Qualcomm Profiler.
It’s called “SysmonApp”, and it’s mentioned in Qualcomm Documentation (no need to login).
“SysmonApp” can be found in Hexagon SDK, which needs registration.
After my test ran for while I hit CTRL-C in the shell that was running the sysmon app:
^CReceived SIGINT in main()
<< Received TERMINATE query signal

***************************EXITING!***************************

>> Sending kill to Query thread...

>> Waiting for the Query thread to join...

The output bin file is placed @ /data/sysmon_cdsp.bin
I copied /data/sysmon_cdsp.bin file back to the PC that has the SDK installed and ran the parser:
c:\tmp>C:\Qualcomm\Hexagon_SDK\6.5.0.0\tools\utils\sysmon\parser_win_v2\HTML_Parser\sysmon_parser.exe sysmon_cdsp.bin
Parser Version : 10.0.29
sysmon_bin_size = 374072
Found header packet: 68, a, 8
Processed packets : 4000
Overflow WARN: Missed 783 samples between 252:47:50:856 and 252:47:52:841
Overflow WARN: Missed 801 samples between 252:47:52:855 and 252:47:53:656
Overflow WARN: Missed 801 samples between 252:47:53:856 and 252:47:54:657
Overflow WARN: Missed 801 samples between 252:47:54:857 and 252:47:55:658
Overflow WARN: Missed 801 samples between 252:47:55:858 and 252:47:56:659
Overflow WARN: Missed 801 samples between 252:47:56:858 and 252:47:57:659
Overflow WARN: Missed 801 samples between 252:47:57:859 and 252:47:58:660
Overflow WARN: Missed 801 samples between 252:47:58:860 and 252:47:59:661
Overflow WARN: Missed 801 samples between 252:47:59:861 and 252:48:00:662
Overflow WARN: Missed 801 samples between 252:48:00:861 and 252:48:01:662
Overflow WARN: Missed 801 samples between 252:48:01:862 and 252:48:02:663
Overflow WARN: Missed 801 samples between 252:48:02:863 and 252:48:03:664
Overflow WARN: Missed 801 samples between 252:48:03:863 and 252:48:04:664
Overflow WARN: Missed 801 samples between 252:48:04:864 and 252:48:05:665
Overflow WARN: Missed 801 samples between 252:48:05:865 and 252:48:06:666
Overflow WARN: Missed 801 samples between 252:48:06:866 and 252:48:07:667
Overflow WARN: Missed 801 samples between 252:48:07:866 and 252:48:08:667
Overflow WARN: Missed 801 samples between 252:48:08:867 and 252:48:09:668
Overflow WARN: Missed 801 samples between 252:48:09:868 and 252:48:10:669
Overflow WARN: Missed 801 samples between 252:48:10:869 and 252:48:11:670
Profiled duration 21244.648 Accumulated sample duration 4060.196
Total NPA packets : 1
Total DCVS packets : 1
Total Profiler packets : 4062
Total DSPPM packets : 1
Finding different packet types
Computing average of PMU metrics
Computing average of other metrics
Generating post processed csv report
Generating raw csv report
Generating PMU accumulated csv report
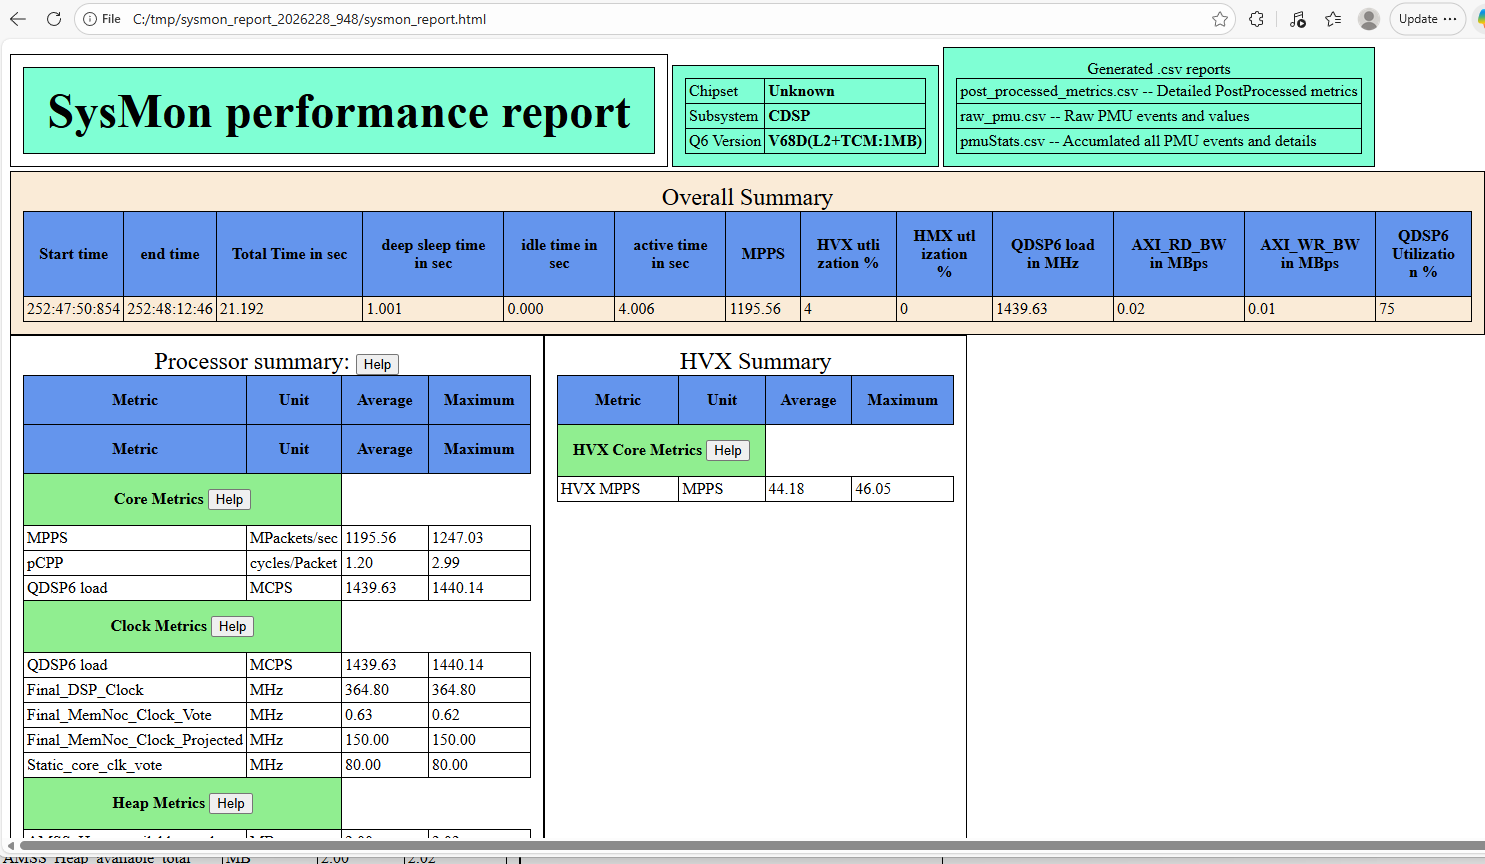
Generating html report
Warning: ChipFamily(118) not foundQDSP6 utlization : 74.60, 4006.19, 1439.63, 910092046.49, 910070854.84, 364.80
Generating html report done
Generating Summary csv report
Warning: ChipFamily(118) not found
I don’t think that’s viable either, we need something we can do entirely on the coprocessor, and get updates live. If there’s a way to make that work it would be great, but that seems to require both post-processing of the data and a separate PC for viewing. I presume you could possibly do the parsing on the Rubik, but we also need it to be available programmatically, which doesn’t seem to be the case here.
The Programmers Reference Manual for v68 in the Hexagon Tools has a section on PMU events and the SDK has the QuRT User Guide with the APPs used below. You will need both of these handy if you want add some measurements to your code.
Thank you for sharing this. The approach we have validated also requires Qualcomm’s sysMonApp tool.
First, run SNPE/QNN or another workload to increase the NPU utilization.
Run ./{HexagonSDK}/tools/utils/sysmon/sysMonApp* profiler --q6 cdsp to generate sysmon_cdsp.bin.
Use {HexagonSDK}/tools/utils/sysmon/parse_*_v2/HTML_Parser/sysmon_parser and run ./sysmon_parser.exe sysmon_cdsp.bin to generate the analysis outputs, including the report and CSV files.